|
|
|
|
|
|
|
||||||||||||||||||||||||||||||||||||||||||||||||
|
Tire Load And Runway Surface Type V+ Design
There are four models in the Tire Load And Runway Surface Type worksheet, shown in Figure 23. These are:
The runway amplitude model’s purpose is to take an enumerated type passed in through the Runway Surface Type port, and covert it to a value normalized between 0.0 and 1.0. The input is limited to 4 and then passed to a One of Eight Selector object. The One of Eight Selector accepts an input value of zero to seven and produces an output of 1.0 on the respective output pin. The pin on the top right is the 0 pin, and the pin on the bottom right is the 7 pin. There are five possible input values that can be passed in. These values and their respective meanings are provided in Table 2. Only the first five output pins of the selector are used. The others are shunted to No Connection objects. Pins 0 through 4 are each passed into a Multiply by Static Data Constant object, which essentially converts the enumerated value into the normalized value shown in column four of Table 2. These values are then passed to the worksheet connector called Runway Amp. The values are summed together using Sum Float objects. The reason for this is to take five lines and merge them into one. Table 2. Runway Surface Type Conversion
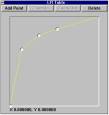
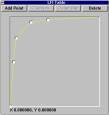
The three tire models are essentially the same, differing only with their primary inputs. Each of these inputs is a gear loading value associated with the respective tire. Each of the players is allocated to the sub-woofer channel (hence the constant for the balance input). Each of the players enable pin is a constant 1 since a zero volume will effectively turn the player off. Volume for the three players is a function of ground speed, gear load and runway amplitude. Each of these inputs passes through an LFI. The LFI for ground speed is shown in Figure 20 and the LFI for gear load is shown in Figure 21. The curve for ground speed starts at 0 and increases toward a value of 1. Note that the curve for gear load rises immediately and levels off at 1. This makes sense, since there is no noise without any gear load. The frequency for these players is only a function of gear load. As the gear load increase, so does the frequency. The input is passed through the LFI shown in Figure 22. The curve starts at about 40% and rises to a final value of 100%. Gear load is actually pretty instantaneous, so the frequency and volume LFIs associated with it will almost always be 100%.
Figure 23. Tire Load and Runway Surface Type V+ Design |
|
|
|||||||||||||||||||||||||||||||||||||||||||||||
|
|
|||
| Home | About | Products | Support | News | Find | Contact Us | |||
|
©SimPhonics Legal Notices Privacy Policy |
|||